
at 768x1024 resolution
 |
|||
| best
experienced with at 768x1024 resolution |
|||
Welcome! In this page we present our software analysis and models for the project.
Project
Specification
This online system should provide the quickest route for commuting between two locations, using the quickest combination of bus stops or MRT stations. The software will use a database that contains the fares, travel time and frequency of all the buses. The web administrator will periodically update the database with new information. The user will indicate the starting point and destination via a click and select interface. The system will then calculate the shortest time taken and a number of appropriate routes. The information will then be displayed on the website.
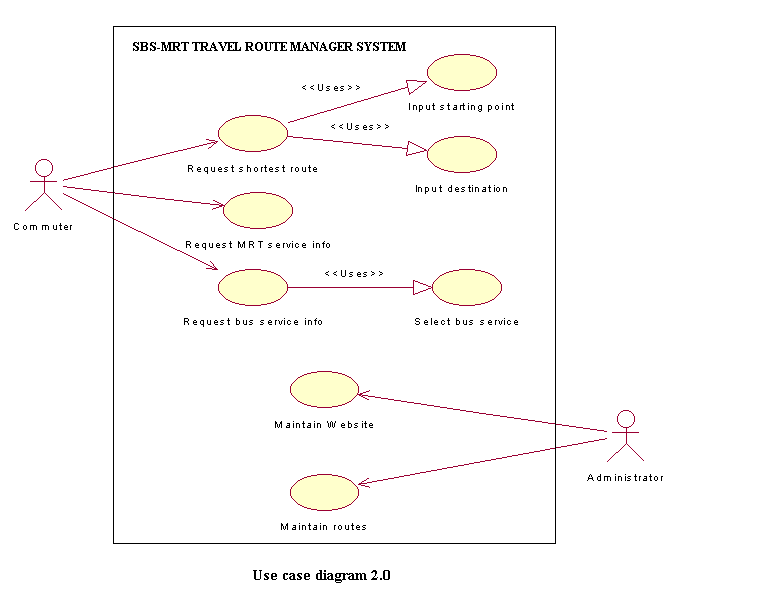
The use case diagram below illustrates the project as defined by our client. We have identified 2 main actors, the user and system administrator. They interact with the website and maintain the database respectively.

Potential List
During Lab 3, we use the Object Oriented Analysis Approach to identify the objects and classes. The following table lists the various potential objects and classes:
Potential List
|
|
System | structure |
|
|
Bus stops | site |
|
|
MRT stations | site |
|
|
Database | structure |
|
|
Fares | thing remembered |
|
|
Travel time | thing remembered |
|
|
Frequency | thing remembered |
|
|
Web administrator | roles played |
|
|
User | external entity or roles played |
|
|
Starting point | thing remembered |
|
|
Destination | thing remembered |
|
|
Click and select interface | external entity |
|
|
Shortest time | thing remembered |
|
|
Appropriate routes | thing remembered |
|
|
Information | thing remembered |
|
|
Website | structure |
Confirm/Reject List
After identifying
the various objects and classes, the list below lists out our confirm/reject
list based on the following criteria and the reasons for confirmation:
1. Need remembrance
2. Needed services
3. Multiple attributes
Confirm/Reject List
|
|
System | confirmed (system itself) |
|
|
Bus stops | rejected (criteria 1 & 2 apply but 3 fails) |
|
|
MRT stations | rejected (criteria 1 & 2 apply but 3 fails) |
| Database | confirmed (criteria 1-3 apply) | |
|
|
Fares | rejected (criteria 1 & 2 apply but 3 fails) |
|
|
Travel time | rejected (criteria 1 & 2 apply but 3 fails) |
|
|
Frequency | rejected (criteria 1 & 2 apply but 3 fails |
|
|
Web administrator | rejected (criteria 1 & 2 fails) |
|
|
User | rejected (criteria 1 - 3 fail) |
|
|
Starting point | rejected (criteria 1 & 2 apply but 3 fails) |
|
|
Destination | rejected (criteria 1 & 2 apply but 3 fails) |
|
|
Click and select interface | rejected (criteria 1 & 2 apply but 3 fails) |
|
|
Shortest time | rejected (criteria 1 & 2 apply but 3 fails) |
|
|
Appropriate routes | rejected (criteria 1 & 2 apply but 3 fails) |
|
|
Information | rejected (criteria 1 & 2 apply but 3 fails) |
|
|
Website | confirmed (criteria 1-3 apply) |
Refined
Use Case Diagram
The preliminary use case diagram was too simplistic. The team has expanded the number of actions that the commuter can perform as required by the client.
Object Diagram
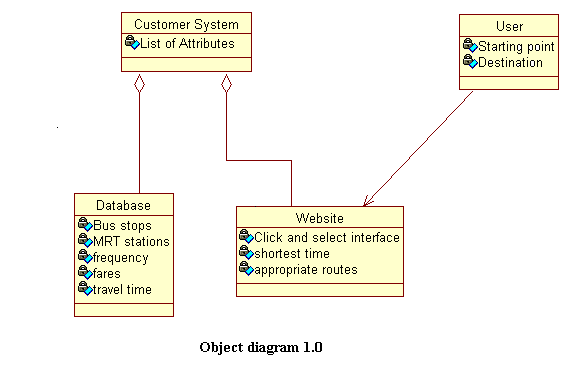
We have also developed a Object Diagram to to illustrate our software development. Thus we can see the class hierarchy and our team will develop our software as accordingly. This will be our preliminary object diagram. Refinements will be done as the software is developed.
Refined Object Diagram
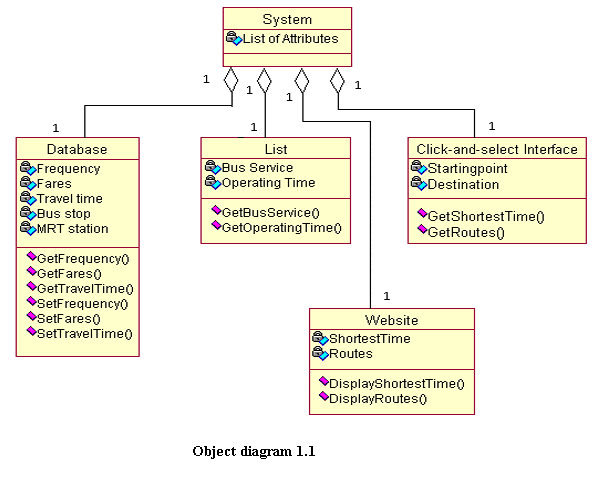
The object diagram below shows our newly refined object diagram. From this new diagram we can also see the various objects instances that we need in order to implement our software and their attributes:
2nd Refined Object Diagram
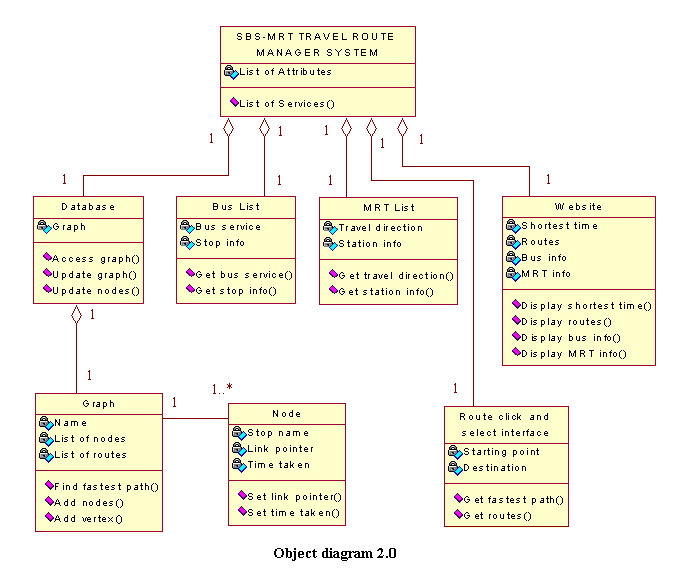
The 2nd refinement is more detailed; Our group has agreed upon the list of services for the software. Hence we will be able to move on to document the class diagram phrase as well as part of the Object Oriented Design.
In order to fully understand the how the software is to be designed and how the various classes interact, there is a need to design the Class diagram. Hence, our group has developed the following initial class diagram that models our intended software:
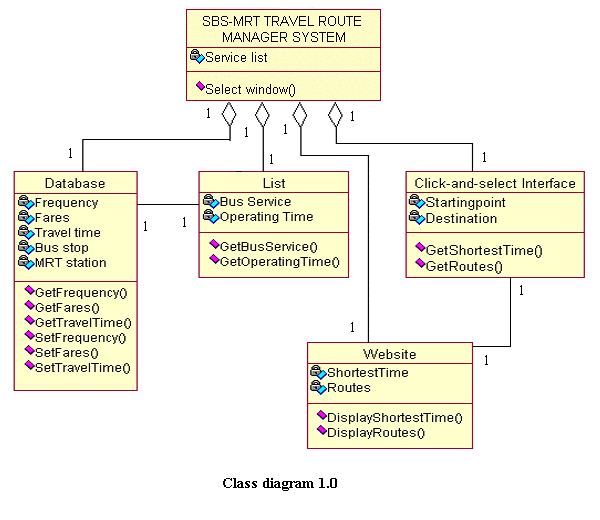
Refined Class Diagram
Upon further analysis of our software, we require to create subclasses to the classes initially designed in the primary class diagram. It adds modularity to the classes and avoid problematic debugging problems should all the functions be grouped together entirely in the same classes. With this refined Class Diagram, we could go on to develop the sequence and collaboration diagrams.

Preliminary
Sequence Diagram
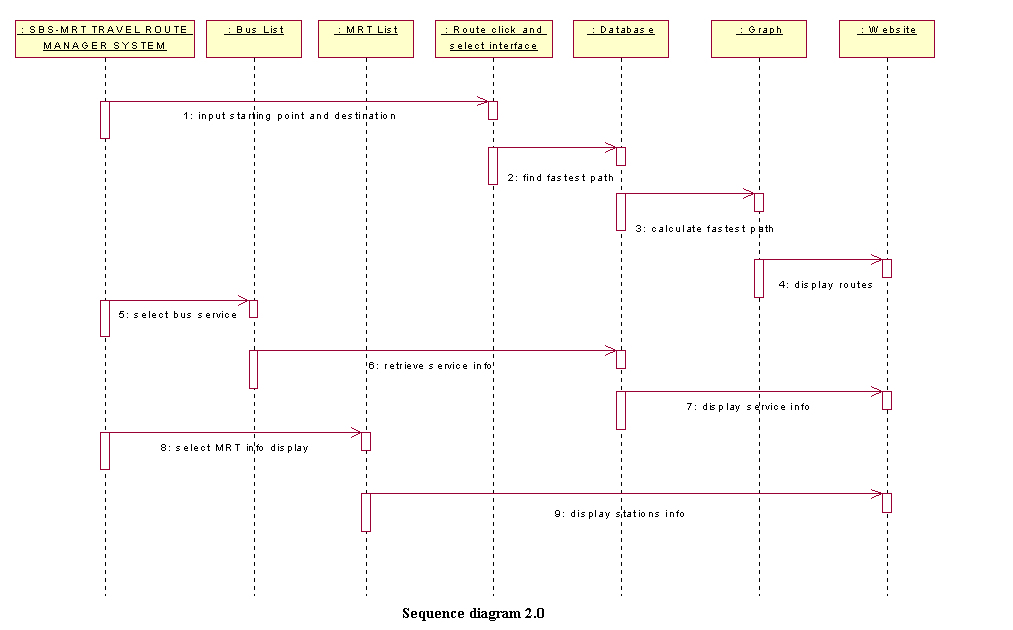
The sequence diagram below shows the flow of the system's performance pattern, beginning from the user's input to the display that the user will see after the various computations have been performed by the software system.
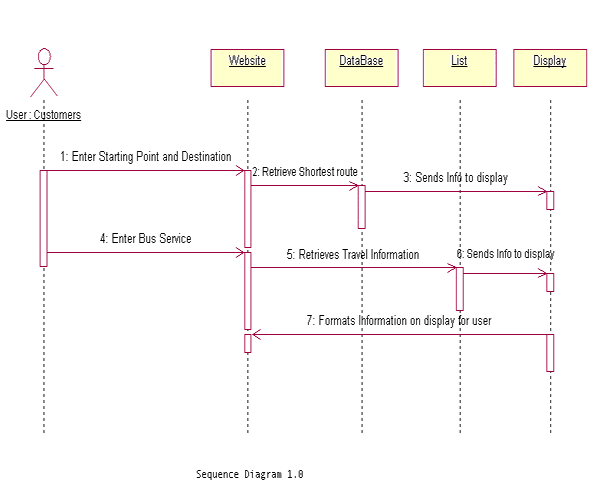
Preliminary
Collaboration Diagram
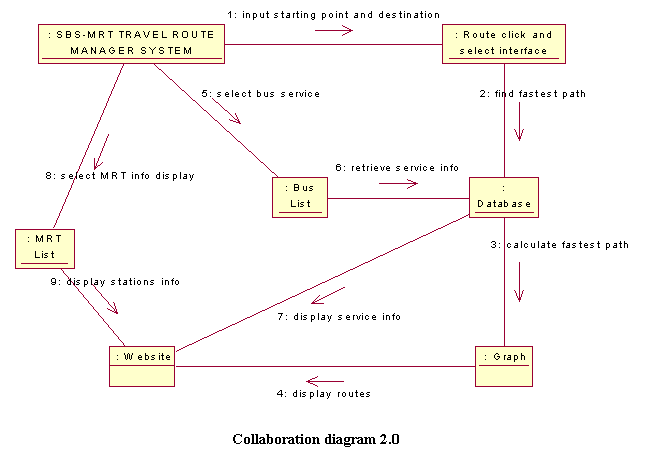
With the sequence diagram, the collaboration diagram has been created as well.

Preliminary
Implementation Diagrams
Implementation diagrams show the aspects of model implementation, including the source code structure and run time implementation structure. Our team is using both Component diagram & Deployment Diagram. The Component diagram shows the organization and dependencies among the components, and the Deployment diagram shows the configuration of the processing elements and the software components, processes and objects that live on them.
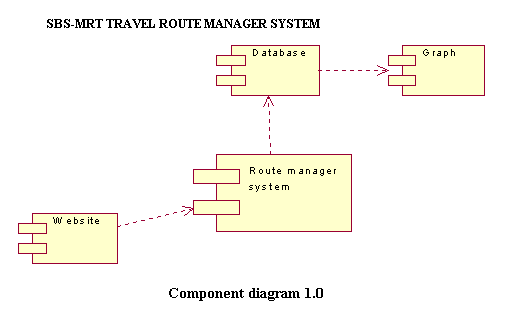
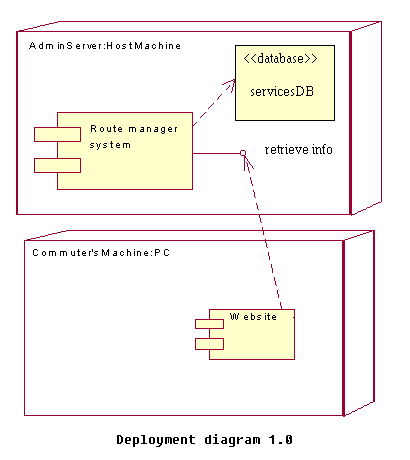
A
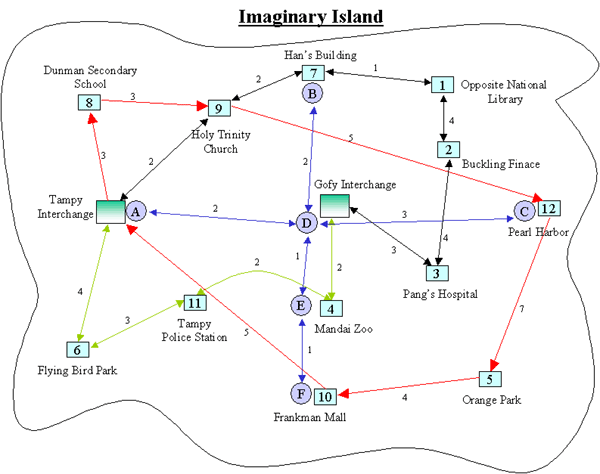
simplified map model for testing
Our team has come up with the following simplified map, which has it's own database of 3 bus service routes and 1 mrt route to aid us in our testing of our database software. This model is generated akin to that of the real life travel system network, except on a smaller scale.
![]()
Refined Collaboration Diagram and Sequence Diagram
Upon further examination, the team has revised both interaction models and expanded them to show how the instances are to interact with each other. Furthermore we have identified more interfaces of the classifiers.
Data Coupling & Cohesion
Data Coupling
Coupling is the degree of interdependence between two components. It is important to reduce the amount of data coupling to a minimum This will result in the following effects:
1. There is less chance of manifestation of the ripple effect (an error in one component appearing as a symptom in another).
2. ability to change one component with minimum risk of having to change another component, and minimize user-requested change to affect as few components as possible.3. Low coupling also enables easier maintenance and improvement of each component without being affected or affecting other components.
| Coupling at implementation level: | |
| 1. | Parameters Passing: |
| This kind of coupling is high in our implementation when we pass parameters, for example the shortest time taken and shortest routes from the databases to display it to our customers. The selection of services of our customers is also passed as parameters to a certain part of our source code that will activate appropriate actions according to the customers' selections. | |
| 2. | Information Clusters(inheritance coupling): |
| The main information clusters arethe data set and data table. These data structures are mainly where our components explicitly share information. | |
| 3. | Common Coupling: |
| There is no common coupling between the two databases. Parameter passing is pre-dominanant in our software as mentioned instead. | |
| 4. | Content Coupling: |
| No such coupling can be seen in our implementation. | |
Data Cohesion
Coupling is the degree of interdependence between two components. It is important to reduce the amount of data coupling to a minimum This will result in the following effects:
1. There is less chance
of manifestation of the ripple effect (an error in one component appearing
as a symptom in another).
2. ability to change one component with minimum risk of having to change another
component, and minimize user-requested change to affect as few components
as possible.
3. Low coupling also enables easier maintenance and improvement of each component without being affected or affecting other components.
Cohesion is also an important aspect to consider. Cohesion is the measure of the strength of functional association of elements within a component. We aim for strong, highly cohesive components, components whose elements are strongly and genuinely related to one another.
With this in mind, our team strives for high cohesion and low coupling. Analyzing our software, we are able to document the the coupling and cohesion levels of the following components of our software:
| Database | |||
| 1 | Attribute: | Graph | |
| 2 | Services: | Access graph() | |
| Update Graph() | |||
| Update node() | |||
| Question: Is the module doing one problem-related function? | |||
| Solution:Yes à Functional Cohesion | |||
| Reason: Access graph() access the graph. Update Graph() replaces this graph with another. Update node() updates a single node. Each service provides solution for one problem only. | |||
| Graph | |||
| 1 | Attributes: | Name | |
| List of nodes | |||
| List of routes | |||
| 2 | Services: | Find fastest path() | |
| Add nodes() | |||
| Add vertex() | |||
|
Question:Is the module doing one problem-related function? |
|||
| Solution:No. | |||
|
Reason: Find fastest path() is required to find the fastest path by accessing the graph, calculating the distance for each possible path and then compare to find the fastest one. |
|||
| Question:What relates the activities within the modules? | |||
|
Solution:Data. |
|||
| Reason:Nodes and vertices added are input to the Find fastest path() to calculate the fastest path. | |||
| Question:Is sequence important? | |||
| Solution:No à Communicational Cohesion | |||
|
Reason: New nodes and vertices can be added to the graph at any point of the running of the program. The Find Fastest path() will then be updated accordingly. |
|||
| Node | |||
| 1 | Attributes: | Stop name | |
| Link pointer | |||
| Time taken | |||
| 2 | Services: | Set link pointer() | |
| Set time taken() | |||
| Question:Is the module doing one problem-related function? | |||
| Solution:Yes à Functional Cohesion | |||
| Reason: Set link pointer() sets the link to point to next stop. Set time taken() sets the time taken between two points. Both perform only one function. | |||
| Route click and select interface | |||
| 1 | Attributes: | Starting point | |
| Destination | |||
| 2 | Services: | Get fastest path() | |
| Get routes() | |||
| Question:Is the module doing one problem-related function? | |||
| Solution:No. | |||
| Reason:Get routes() gets the route for the shortest path and since each route is made up of different nodes, more than one function is being done. There also may be more than one route. Get fastest path() just gets the value for that path and hence is doing one problem-related function. | |||
| Question:What relates the activities within the modules? | |||
| Solution:Data. | |||
| Reason:The value found from the Get fastest path() is used to get the routes. | |||
| Question:Is sequence important? | |||
| Solution:Yes à Sequential Cohesion | |||
| Reason:Since it is necessary to find get the shortest path value to find the exact route, there is a sequence to be followed. | |||
| Bus
List |
|||
| 1. | Attributes: | Bus service | |
| Stop info | |||
| 2. | Services: | Get bus service() | |
| Get stop info() | |||
| Question:Is the module doing one problem-related function? | |||
| Solution:Yes | |||
| Reason:Get bus service() displays the routes each bus will take, while Get stop info() displays the information about each stop. | |||
| MRT
List |
|||
| 1. | Attributes:: | Travel Direction | |
| Station Info | |||
| 2. | Services: | Get travel direction() | |
|
Get station info() |
|||
| Question:Is the module doing one problem-related function? | |||
| Solution:Yes | |||
| Reason:Get travel direction() and get station info() together displays the information of the stops in the direction specified. | |||
| Website |
|||
| 1. | Attributes: | Shortest time | |
| Routes | |||
| Bus info | |||
| Mrt info | |||
| 2. | Services: | Display shortest time() | |
| Display routes() | |||
| Display bus info() | |||
| Display MRT info() | |||
| Question:Is the module doing one problem-related function? | |||
|
Solution:No. |
|||
| Reason:Each service does a different function and requires different inputs. | |||
| Question:What relates the activities within the module? | |||
| Solution:Neither | |||
| Reason:Depending on the function selected, each function requires different inputs | |||
| Question:Are the activities in the same general category? | |||
| Solution:Yes -> Logical Cohesion | |||
|
Reason:Each function will display information on the screen. |
|||