S29 or
R1b1c9b
John McEwan
25th
June 2006 updated 22nd July 2006
Background
This SNP defines a sub-subclade of R1b1c. Only sparse information about
this SNP has been released due to commercial constraints. Ethnoancestry, announced the
availability of this SNP on 13th December 2005. At the time of
announcement they stated it had been observed twice in two samples of British
origin (probably English). These results are not publicly available. At the
time they publicly thanked Gareth Henson
in its development and referred to searching NCBI dbSNP, so it can be assumed
that it is present, but uncharacterized, within that database. For details
about its current position in the Y chromosome haplogroup tree and other
information see www.isogg.org/tree .
Occurrence
In February 2006 the first publicly announced S29+ individual was
released whose ancestors reputedly came from England (Ysearch ID F323W, Lovelace). In May 2006 the second was identified
(7RCAT, Foster) who traces his
ancestry to Durham county, England from the 12th century. In private
correspondence he indicated the family name was Forster until the mid 20th century. He also indicates
that there is some speculation that the earliest Angles came to Durham in the 6th
century AD as an overspill from Norfolk and Suffolk (East Anglia). A third person (Rust BVB6V) whose ancestry traces to Norfolk was identified in
July. The distribution suggests south east and north east England, but we need
many more tested to make more definitive statements. Forster was used instead
of Foster due to known surname history.
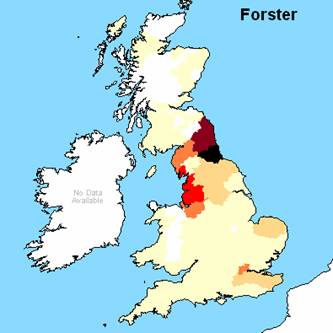

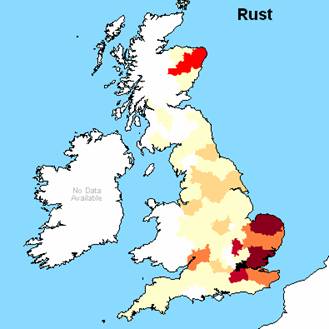
Figure 1. 1881 geographical
distribution (frequency) for the three S29+ individuals surnames, note Forster
used instead of Foster and private correspondence suggests Lovelace has
multiple origins and Dorset is NOT the origin of the S29+ individual.
To date only 3 out of 44 individuals have tested S29 positive and of
these: 0/1 has tested positive in the M167+ subclade, 0/2 have tested positive
in the M222+ subclade, 0/2 in the S28+ subclade, 3/20 (15%) in the S21+
subclade, and 0/21 in R1b1c(xM167,M222, S21,S28). These results clearly confirm
its position as a significant subclade within the R1b1c9 (S21+).
The three positive individuals are at a genetic distance of up to 7 from
the modal and up to 13 from each other. All are located within the R1bSTR3 haplotype cluster that is
largely consistent with Frisian 2 or
R1b-F2 group subsequently defined by Ken Nordtvedt. The maximum genetic
distance between the two most extreme individuals suggests an age for S29+ of
more than several thousand years.
For further information about this cluster see:
Stated origins of cluster members
Cluster variability and estimated age
R1bSTR3 cluster members from phase 3
analysis
Specifically, the cluster is distinguished by a DYS390=23 a DYS464 =
15-15-17-18 YCA-II =19, 22 and several other attributes. It makes up about 3%
of England R1b and 2% of Western Continental Europe R1b. The R1bSTR3 cluster is not entirely
homogeneous, because at least one member has turned out to be S21-. The tables below compare the haplotype modal
of the three individuals with the individuals and various relevant groups.
Summary
It is tempting fate to extrapolate based on only 3 reported S29+
individuals. However, the current situation is:
·
S29+ is a confirmed subclade of R1bc9 and is correctly placed on the Y chromosome ISOGG tree
·
It is at least several thousand years old, but any
attempt at aging it will require additional testing
·
It appears to date to be coincident with a haplogroup
cluster called R1bSTR3 or F2
·
The three people publicly reported as S29+ are English
and based on the knowledge about their parent clade S21+ it is reasonable to
speculate a northern European origin for S29+. It must be remembered that
Ethnoancestry has also reported that two other British (probably English)
individuals were S29+ as well.
·
The SNP is likely to present at reasonable frequency
in the R1b population with R1bSTR3 making up 2% of R1b.
|
ID |
D |
D |
D |
D |
D |
D |
D |
D |
D |
D |
D |
D |
D |
D |
D |
D |
D |
D |
D |
D |
D |
D |
D |
D |
D |
D |
G |
Y |
Y |
D |
D |
D |
D |
C |
C |
D |
D |
|||||
|
S29_modal |
13 |
23 |
14 |
11 |
11 |
15 |
12 |
12 |
12 |
13 |
13 |
29 |
17 |
9 |
10 |
11 |
11 |
25 |
14 |
19 |
29 |
15 |
15 |
17 |
18 |
11 |
11 |
19 |
22 |
16 |
14 |
16 |
17 |
37 |
40 |
12 |
12 |
|||||
|
7RCAT_Foster |
13 |
23 |
14 |
11 |
11 |
14 |
12 |
12 |
11 |
13 |
13 |
29 |
17 |
9 |
10 |
11 |
11 |
25 |
14 |
19 |
29 |
15 |
15 |
17 |
18 |
11 |
11 |
19 |
22 |
16 |
14 |
16 |
17 |
37 |
38 |
12 |
12 |
|||||
|
BVB6V_Rust |
13 |
23 |
14 |
11 |
11 |
15 |
12 |
12 |
12 |
13 |
13 |
30 |
18 |
9 |
10 |
11 |
11 |
25 |
15 |
19 |
29 |
15 |
15 |
17 |
17 |
11 |
11 |
19 |
22 |
15 |
14 |
16 |
17 |
35 |
40 |
12 |
12 |
|||||
|
F323W_Lovelace |
13 |
23 |
14 |
11 |
11 |
15 |
12 |
12 |
12 |
13 |
13 |
29 |
17 |
9 |
10 |
11 |
11 |
24 |
14 |
19 |
29 |
14 |
15 |
17 |
18 |
10 |
11 |
19 |
21 |
16 |
14 |
17 |
17 |
37 |
39 |
12 |
12 |
|||||
|
R1bSTR3 |
13 |
23 |
14 |
11 |
11 |
14 |
12 |
12 |
12 |
13 |
13 |
29 |
17 |
9 |
10 |
11 |
11 |
25 |
15 |
19 |
29 |
15 |
15 |
17 |
18 |
11 |
11 |
19 |
22 |
15 |
14 |
16 |
17 |
37 |
39 |
12 |
12 |
|||||
|
R1bSTR22Frisian |
13 |
23 |
14 |
11 |
11 |
14 |
12 |
12 |
12 |
13 |
13 |
29 |
17 |
9 |
10 |
11 |
11 |
24 |
15 |
19 |
29 |
15 |
16 |
17 |
18 |
11 |
10 |
19 |
23 |
17 |
15 |
17 |
17 |
37 |
39 |
13 |
12 |
|||||
|
R1bSTR27 |
13 |
23 |
14 |
11 |
11 |
14 |
12 |
12 |
12 |
13 |
13 |
29 |
17 |
9 |
10 |
11 |
11 |
25 |
15 |
19 |
29 |
15 |
15 |
17 |
17 |
11 |
11 |
19 |
23 |
17 |
15 |
18 |
17 |
37 |
38 |
12 |
12 |
|||||
|
R1bSTR32 |
13 |
24 |
14 |
10 |
11 |
14 |
12 |
12 |
12 |
13 |
13 |
29 |
17 |
9 |
9 |
11 |
11 |
25 |
15 |
19 |
29 |
15 |
15 |
16 |
17 |
10 |
11 |
19 |
23 |
15 |
15 |
17 |
17 |
37 |
38 |
12 |
12 |
|||||
|
R1b |
13 |
24 |
14 |
11 |
11 |
14 |
12 |
12 |
12 |
13 |
13 |
29 |
17 |
9 |
10 |
11 |
11 |
25 |
15 |
19 |
29 |
15 |
15 |
17 |
17 |
11 |
11 |
19 |
23 |
15 |
15 |
18 |
17 |
37 |
38 |
12 |
12 |
|||||
|
R1a |
13 |
25 |
15 |
10 |
11 |
14 |
12 |
12 |
10 |
13 |
11 |
30 |
15 |
9 |
10 |
11 |
11 |
23 |
14 |
20 |
32 |
12 |
15 |
15 |
16 |
11 |
11 |
19 |
23 |
16 |
16 |
18 |
18 |
34 |
39 |
12 |
11 |
|||||
|
||||||||||||||||||||||||||||||||||||||||||
|
Genetic Distance |
|||||||||||||||||||||||
|
ID |
S |
7 |
B |
F |
R |
R |
R |
R |
R |
R |
|
||||||||||||
|
S29_modal |
37 |
4 |
7 |
6 |
4 |
11 |
10 |
13 |
11 |
31 |
|
||||||||||||
|
7RCAT_Foster |
4 |
37 |
11 |
8 |
4 |
11 |
8 |
11 |
9 |
29 |
|
||||||||||||
|
BVB6V_Rust |
7 |
11 |
37 |
13 |
7 |
16 |
13 |
15 |
12 |
31 |
|
||||||||||||
|
F323W_Lovelace |
6 |
8 |
13 |
37 |
8 |
9 |
11 |
12 |
12 |
30 |
|
||||||||||||
|
R1bSTR3 |
4 |
4 |
7 |
8 |
37 |
9 |
8 |
9 |
7 |
31 |
|
||||||||||||
|
R1bSTR22Frisian |
11 |
11 |
16 |
9 |
9 |
37 |
7 |
11 |
10 |
29 |
|
||||||||||||
|
R1bSTR27 |
10 |
8 |
13 |
11 |
8 |
7 |
37 |
8 |
3 |
28 |
|
||||||||||||
|
R1bSTR32 |
13 |
11 |
15 |
12 |
9 |
11 |
8 |
37 |
5 |
28 |
|
||||||||||||
|
R1b |
11 |
9 |
12 |
12 |
7 |
10 |
3 |
5 |
37 |
27 |
|
||||||||||||
|
R1a |
31 |
29 |
31 |
30 |
31 |
29 |
28 |
28 |
27 |
37 |
|
||||||||||||
|
|||||||||||||||||||||||
|
- Hybrid mutation model is used |
|||||||||||||||||||||||