Approaching the
Normal
Curve
(Historically & Visually)
Historically:
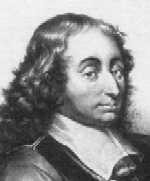
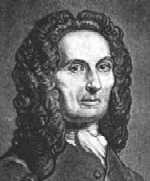
Blaise Pascal
(1623-1662)
|
1
1 1
1 2 1
1 3 3 1
1
4 6 4
1
1 5
10
10
5
1
1 6 15 20 15
6
1
etc.
(Each interior entry is the sum of the two above.)
|
Pascal's triangle, published
1653, was known
centuries earlier.
One of its many uses is for the coefficients
in binomial
power expansions. For example,
[See another application of Pascal's triangle here.]
|
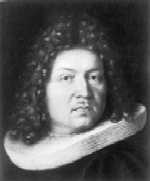
Jacques Bernoulli
(1654-1705)
|
Toss n = 4 coins
x = Number of heads
|
Bernoulli found Pascal's triangle useful for
probability
distributions of binomial trials (i.e. where there is a fixed number of
identical and independent repeated trials, each trial having two
possible
outcomes). For example, the distribution to the left corresponds
to the row:
{1, 4, 6, 4, 1}
(His nephew discovered the principle of flight.)
|
Abraham DeMoivre
(1667-1754)
|
Frequency Curve
|
DeMoivre was the first to discover that as n
(the
number of trials) increases, Bernoulli's binomial distributions
approach
a unique continous distribution. His work was
largely
unnoticed, so the curve was rediscovered independently by others
including
LaPlace (1749-1827), and... |
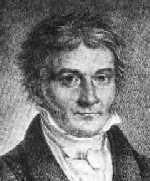
Carl Gauss
(1777-1855)
|
The curve's equation:
has:
fixed numbers, p
and e,
parameters, m
and s,
and just one variable, x.
|
Gauss also rediscovered the curve. He
found so
many uses for it, that it became known as the Gausian distribution
function.
Today it's called the normal bell-shaped curve.
Gauss' least squares method resulted in a
refined equation.
But the ultimate refinement uses s, for
standard deviation, which was coined by Pearson (1857-1936).
|
Visually:
| The highlight of this page is a brief movie,
each frame
of which is a binomial distribution. The first frame has the
number
of trials (e.g. coin tosses) set at n=1, the second has n=2, the kth
has n=k. Thus, successive frames picture successive rows in
Pascal's
triangle.
By flipping through the frames, an animation
is created.
So you can see the binomial distributions approaching
the
normal curve. The convergence however, may not go the way you
would
expect!
See
the movie
Requires QuickTime plug-in or player,
available free from:

www.apple.com/quicktime/download
|
Links:
The University of St. Andrews in Scottland has a
great
biographies site. Click any of the pictures above to see the
respective
mathematician's biography page, or go to their index.
Bernoulli trials are explained here,
and a binomial distribution graphing utility is here.
An interesting connection has been discovered
between
Pascal's triangle and the classic fractal called Sierpinski's gasket,
which
can be seen here,
and a nice applet is here.
Binomial distributions are not the only approach to
the
normal bell curve. Indeed, the Central Limit Theorem tells us
that
the sum (or mean) of n observations from any
distribution
will approach a normal distribution as n increases. This
is
illustrated by a very captivating applet called Ball
Drop at the Java Boutique.
A most interesting connection can be made between
the
concept of the movie (namely that after n has been increased a
countable
infinity of times, we arrive at a curve made up of an uncountable
infinity
of points) on one hand, and Cantor's Theorem on the other. Sorry,
no link for this (yet).
Go to table of contents,
or send
email.
___________
Movie created: Fall, 1996
1st Published: July 8, 2001
Revised: June 6, 2003
Moved to Yahoo-GeoCities December 29, 2005