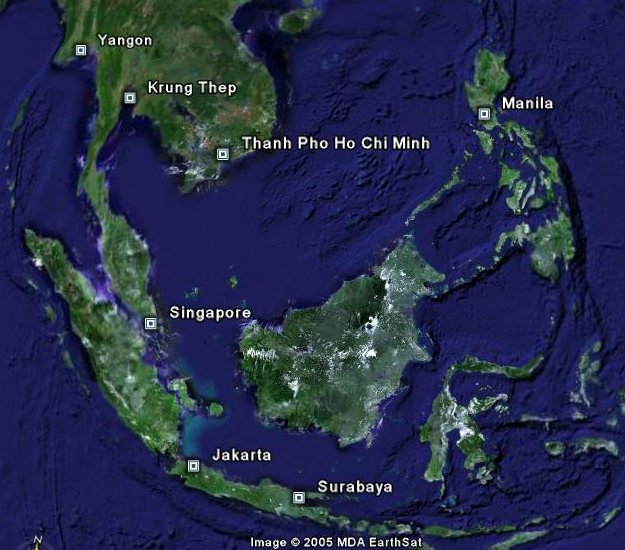
This page is experimental and created for fun mainly. I'm intrigued by satellite imagery and especially now with the availability of images from Google Earth. Below is a copy of one such image taken of a region in Oceania/Southeast Asia.
 I happen to be interested in the measurement of distances from point to point on the surface of the earth. Distances are usually determined by means of trigonometric calculations from lat/long data. There are online javascript calculators, among others, that will do the job. Earth images, however, could provide the potential for estimating distances as well without the need for independent calculations each time. What is needed, though, is a small number of calibrating points which can then be used to estimate many distances. What you see in the Google Earth images are, of course, 2-dimensional representations of a 3-dimensional Earth. Assuming the Earth is a sphere (a quite reasonable assumption actually), connecting any two points on the image with a straight line corresponds to a chord of a sphere rather than to a great circle (GC). I was curious initially in knowing to what extent GC distances compared to the chord corresponding to two such points. In other words, how much longer is a great circle arc than the underlying chord? Obviously, the difference will be a function of overall distance. But, for starters, if the chord were exactly one radius in length, how would the comparison look? The internal triangle has a central angle of 60 deg. Arc length is the product of radius and angle in radians, so if the earth has an equatorial radius of 3,963 statute miles, the GC length would then be 4,150 statute miles, an increase of 4.7%. What about shorter distances?
What's surprising here, to me anyway, is how fast the various corresponding distances converge. A 2,000-mile GC distance differs only by some 20 miles from its underlying chord, and lesser distances show only minor differences from their respective chords. What this means is that linear measurements taken directly from these types of satellite images should be useable to estimate similar distances with surprising accuracy (depending on the error rate a person is willing to live with, of course). Below is a calibration chart that illustrates the differences between GCs and their corresponding chord distances.
 Take a look at the following image from a zoomed portion of the one above that has been modified somewhat. 
|