
|
|
Philadelphia and Northeast High School (data, graphs and analysis) |
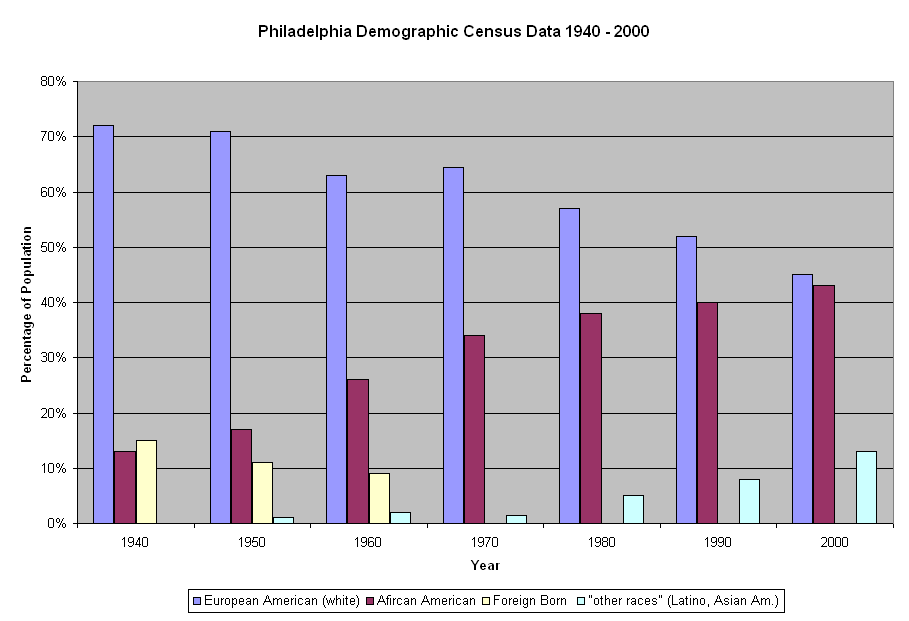
| Philadelphia's population in 1950 was over 2 million.
Over 70% of the population was European American (white). By
2000, Philadelphia had less than 1.5 million people and the
European and African American population was almost identical.
The percentage of African American, Latino/a and Asian America students
in the School District steadily increased. In 1940, 20.4% of
the students in Philadelphia schools were African American. By 2001,
65.3 % of the student body was African American, 4.9% Asian
American, 13.1% Latino/a, and 16.4% European American. Northeast High School began a voluntary desegregation program in 1977 - 78 for staff and students. By 1982 - 1983, nearly 30% of the student body was African American. In 2002-2003, nearly 30% of the student body is African American. Today there are more Asian American and Latino/a students than in the late 1970s. Northeast continues to have a significant number of immigrant students from all around the world. |
| Return to Home Page |
|
Changing Philadelphia Demographics
from presentation by Dr. Anne Phillips Demographic changes in the U.S.: During the 1950s, 1.5 million African American migrated from rural areas to urban areas During the 1960s, 1.4 million African American migrated from rural areas to urban areas Demographic changes in Philadelphia: Between 1940 and 1950, 90,635 African Americans migrated to Philadelphia Between 1950 and 1960, 64,974 African American migrated to Philadelphia In the decade 1950 - 1960, Philadelphia's African American, Latino/a, and Asian American population increased 41.2%; the European American population declined 13.3% African American demographic isolation: North and West Philadelphia became "virtually" African American Racial change occurred quickly in Strawberry Mansion, Tioga and Southwest Philadelphia Between 1930 - 1970, the index of African American isolation in Philadelphia rose from 27.3% - 75.6% In the 1950s, Philadelphia's Puerto Rican community began to increase. Demographics in Philadelphia schools: The rapid transformation of the racial makeup of neighborhoods was matched in the schools African American students enrollment went from 20.4% in 1940 to 47% in 1960 African Americans were the majority of students, 51%, in 1960 in elementary schools Less than half of the European Americans students, 48%, were enrolled in public schools while 92% of African American students were enrolled in public schools |
|
|
| source: U.S.
Census Data |
|
| U.S. Census data until 1960 included
a "foreign born" category. The data is separate from African
American and European American though immigrants represented different
regions of the world. In 1950 "other races" was included."
This includes Latino/as, Asian Americans and Native Americans /
Pacific Islanders. (source: U.S. Census
Data) |
| TOP |
| We did not find information with this
map. Therefore, we aren't positive how the map was used. Nevertheless,
it appears to have demographic data that could be used for the School
District voluntary desegregation program. We don't know why
there is a distinction between "Puerto Rican" and "Spanish Language." |

Compiled from DESEGREGATION
(1974)
Published by the National School Public Relations Association |
|
|

|
| From 1977-78 - 1981-82,
the School District listed "racial composition" as "Black," "Hispanic"
and "Other." Therefore, we don't know the exact percentage of European
or Asian American students. In 1982 - 1983, students were
classified as "American Indian/Alaskan, Asian/Pacific Islander, Hispanic,
Black (Non-Hispanic) and White (Non-Hispanic). Therefore, in 1982
-83, 66.7% of Northeast students were "white" and 2.4% were "Asian/Pacific
Islander." In 2001-02, 51.3% of the students were "white" and
10.5% "Asian." In 2002-03, 45.4% are "white" and 12.4% are
"Asian." (information from "Pupil Data" files from the School
District of Philadelphia) |
|
**(until 1982-83, staff were classified as "Black,' "white," and "other." In 1982 -83, American Indian, Asian and Hispanic were added.) |

|
| The School District
from 1977-1982 listed instructional staff as "Black," "white" and "other."
In 1982-83, staff were listed as "American Indian/Alaskan,
Asian/Pacific Islander, Hispanic, Black (Non-Hispanic) and White (Non-Hispanic).
In 1982-83, .08% of the staff was "Hispanic." There
were no American Indian/Alaskan or Asian/Pacific islander teachers. |