
Math Page: Statistics Project
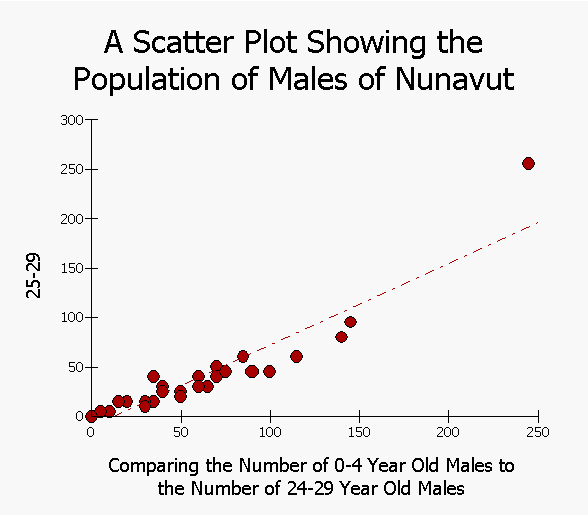
The are which was picked in this study was the Nunavut area. Because of the harsh conditions which are present in this area a very low population density is expected. It is thought that in this area the relationship between age and the relative number of males and females will be a very interesting figure. One would expect that though just as many females as males are born in the Nunavut area, as age increases many females would emigrate from this area to more southerly areas while the males would make a living off of the local natural resources industry. This is why the age group of 25-30 was picked to study. At this time people are making real choices about what they want to do with their lives and the likelihood of leaving Nunavut is the highest at this age.

As can be seen from the graph above in most areas the population of men slightly exceeds the population of women. In the above graph the slope of the line is slightly less than one, giving a predisposition to a higher population of males. As stated in the conjecture the females tend to leave this area while the males stay behind. Unfortunately the conjecture is disproved when comparing the ratio of the population of males at ages 0-4 and at ages 25-29 to the ratio of females at ages 0-4 and at ages 25-29.

These two graphs show a surprising contradiction to the conjecture. There are approxamately the same amount of females as males in Nunavut. As the slopes of the two graphs are approxamately the same.
2.
The other areas that were researched in this statistical analasis were the averages for all of Canada, and also the statistics for Prince Edward Island. As suspected, the male to female ratio for all of Canada and Prince Edward Ilsnd were significantly higher than the ratio for Nunavut. This is most likely due to the fact that the vast majority of the carrer choices in Nunavut were male oriented jobs, as well as the climate and lack of distribution centers.

This graph is the exact opposite of the Nunavut graph. Though it is not known exactly why the ratio of females to males is higher in PEI than the overall average, this ratio is much higher than in Nunavut. The slope of this line is very shallow indicating a very prevalent female population.

As is evident from the above graph the ratio of females to males is approximately equal. The slope of the graph is approximately 1. This is because it averages the areas where there is a male prevalent population (such as Nunavut) and the areas where there is a female prevalent population (such as PEI).
3.
|
|
As can be seen from the graph on the left the life expectancy for both men and women has dramatically increased from 1920 to 1990. Although the life expectancies for both men and women have increased substantially over the years it has increased more for women than for men. The quartic correlation for men is |
1.5x^4 - .0121x^3 +35.5x^2 -46183.6+22559252.9 with a R^2 value of 1. If this is extrapolated the predicted life expectancy for this the life expectancy for a male in 2050 is 202 years and for females 210 years …. Perhaps there are not enough data points. A website which did not use only a mathematical method set this figure at 81.67 years for males and years 85.26 for females. (http://www.netbiosciencenews.com/NR/2000/July00/Life%20expectancy.htm)
4. The areas picked during this statistical analysis of life expectany were Nunavut, Prince Edward Island, and the Canadian average. Nunavut and Prince Edward island were picked because the demographics and the tpe of industry they rely on are completely different. The Canadian average was picked because this represents a control. This will form a median between the two extremes. It would be thought that the life expectancy in Prince Edward Island would be much higher than in the rest of Canada. This is because Prince Edward Island is a place where many people go to retire, while Nunavut is not. This means that since people have the money to retire and live in Prince Edward Island, they can also afford things to extend their lives, such as prescription medicines, and a balanced diet. Nunavut, on the other hand, is definitely not a retirement place. The overall population tends to be poorer than the national average and the harsh climate, and dependancy on more dangerous activities such as hunting means that the life expecancy is probably lower here.
The tables for life expecancy at birth were retrieved from http://www.stanleyconsulting.ns.ca/Files/Life_Expectancy_at_Birth.pdf
As can be seen from the table, the average life expectancy for both sexes in Nunavut is 69.8 years old. This is significantly lower than 78.3 years, which is the Canadian average. In Prince Edward Island the average life expectancy for both sexes is 77.3. This part disproves the conjecture by being slightly below the national average. This could be because of extraeneous variables such as the fact that Prince Edward Island is host for a number of dangerous activities such as farming.
Evaluation
This evaluation was overall a success as the object of it, to note a number of interesting trends, was completed. The data which were used in this project was probably the best possible. With Nunavut there is a sample of an area with a very low population density, this is a harsh climate and there are a very high amount of push factors here. The other sample was Prince Edward Island. Here is a very temperate climate due to the moderation effect of the Atlantic Ocean. There are a number of pull factors where and a higher female population is the result. The final sample is the average of all of Canada. This is appropriate since all of the other provinces cannot be represented due to time restraints. The mathematical methods which were used are not as reliable as they could be, for example a quartic regression predicts the life expectancy of a person in 2050 as a little over 200 years old. This is obviously not accurate. A more holistic approach would have predicted this, most likely more accurately, at a little over 80.
As for the amount of people who are interested in this information, there is a huge amount of people interested in this. This allows, for example the government to predict if someone is likely to outlive their pension. It allows advertisers to advertise demographically in certain regions because they know exactly what age the people who are in that specific region, and who are most likely to see their advertisements. There are quite a few questions from this analysis that are unanswered. For example why are there a larger amount of females in Prince Edward Island than males? Also is the stated reason for there being a higher number of males in Nunavut than females correct? There was no definite answer which could be found for this in the research which was done. In future projects a resource could be found which takes into consideration push and pull factors for various demographics of a population. Another question was how demographics were set up in other areas of Canada and abroad, are they the same as Canada? If not, how do they differ? And why? A resource which took into account international demographics would have to be found to study this properly. If this project were to be done again then a larger sample would have been taken. In this analysis only 2 provinces were compared against the whole of Canada. At least all of the provinces should have been taken into account and some international sample should have also been taken.
