It's topo-licious!
Oddly, there is a plethora of topographical information available on the Internet. And coincidentally, making real and fictitious computer-generated landscapes is also quite easy. This page will serve as a gallery of images, a tutorial, and an index to resources.
Table of Contents - Gallery The gallery of images.
- Information What else?
- Data Collections Where to download DEMs, DLGs, and other acronyms.
- Programs A list of data processing and graphical rendering programs. All the programs I've used for the images here are listed.
Gallery
Click on the small images to see a larger version.
New images are added to the top.
Mars Face The real face on Mars.
Sunrays I Another ocean view, now with volumetric lighting so the beams of light can be seen going through the atmosphere. Compare with Sky & Water below.
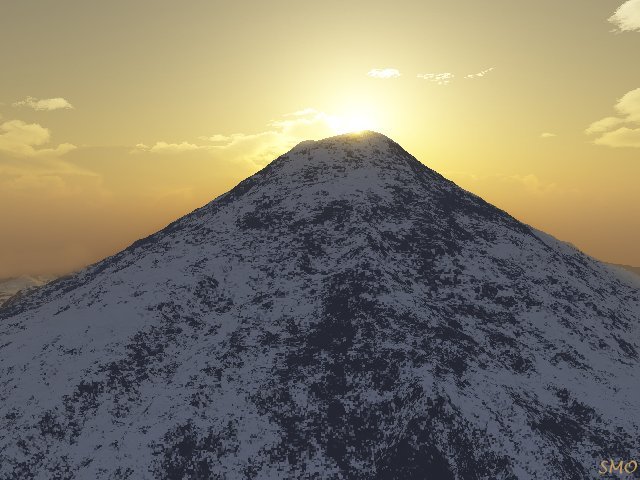
Mountain III A generic mountain view.
Mountain II Yet another lovely mountain vista.
Canyon I Fairy unrealistic water...
River I Another one of my first images made with Terragen 0.7 (reflective water). One of my favorites - a realistic river with muddy water.
Sky & Water A Terragen-rendered image. Basically, it's the sky... and a sunset... and the ocean.
Steptoe A geological feature in eastern Washington state. The color's a bit off and the vertical scale isn't exact, but other than that...
Sunset A generic Terragen image.
Pyramids The height field was created for the pyramids by using a rectangular gradient fill pattern in Paint Shop Pro and pasting differently-sized copies of the fill pattern in different places across the map. This creates three-dimensional pyramid shapes.
Temple This was created similarly to the method for the pyramids, using a gradient pattern. But, after the pattern was in place, I used non-standard color reduction to reduce the image to 30 colors, which had the effect of turning what would normally be a smooth pyramid into a stepped pyramid. It can hardly be seen, but the steps are covered in green on top while the sides are rock-colored.
Two Worlds Terragen and Raytracing come together. The mountains in the foreground are a Terragen-generated image which I used as an image map (with the sky part transparent) and stuck in a raytraced scene with the galaxy and stars in the background.
Mt. St. Helen's An actual satellite view of Mt. St. Helen's (top) and an image created from digital data (bottom).
Mt. St. Helen's Created with data from the USGS and the program Terragen. Since Terragen can only import raw 8-bit graphical data*, I converted the DEM information to a Targa, which I resized to 257x257 resolution in Paint Shop Pro. Then I saved it as an 8-bit greyscale RAW file and imported it into Terragen where I added the texture and 3-D clouds.
* Or there are programs listed below to import and export in Terragen's TER format.
Mt. St. Helen's Before Image The mountain on the morning before its Big Day? The USGS has data from before and after.
Fake Terrain The first image I ever created in Terragen, using random terrain.
Dawn Morning scene of a fictitious mountain created in Terragen. I increased the contrast in Paint Shop since I couldn't get the sun bright enough using Terragen.
Spokane I can't remember what data I used for this, but I think it's from around Spokane (eastern Washington state). Kashmir has two rendering modes: Z-buffer and raytrace. This shows Kashmir's raytraced and perfectly reflective water. As usual, Kashmir's ground textures are very unrealistic since it simply maps a texture onto the heightfield.
Generic Mountain A generic mountain with interesting clouds. Actually taken from USGS data for Steptoe Butte (see above), but the vertical scale was stretched and a different texture was used for the mountain.
Asotin, Washington Comparison of an image created electronically (using DLGv32) and an actual aerial photograph. The Snake River is the vertical waterway on the east side; the horizontal branch at the top of the image is Asotin Creek. The sleepy villa of Asotin exists in the area where the two waterways connect at the top of the image; about 32 miles south of Pullman. Clarkston is just out of range north of this map. The area of this is about 18 miles wide by 20 miles high. The original aerial photograph was very dark grey, so I increased the brightness, contrast, and added some color. Took a bit of time trying to figure out how these maps are related since the digital data covers an enormous area and I wasn't even sure the picture I had showed anything relating to the data or even if they both were at the same scale.
Also see the Programs and Data sections.
Information
- Bitmap
- A file containing a rectangular array of color values, as opposed to other formats that might store line-based information. I don't believe formats like JPG are considered bitmapped since they actually lose image information during compression and there is no certain color for any single point, whereas formats like GIF, though they compress, don't lose information in the process and store every pixel as a certain color. Other commonly used bitmap formats are Targa (TGA) and Windows bitmap (BMP). Bitmapped images are usually used for heightfields.
- DEM
- Digital Elevation Map. A file which contains topographical information over a set area. Information is usually stored as a text file and typically contains such information as the geographical location of the four corners of the data, the values of the highest and lowest points, and which units are used in the DEM to measure these (typically arc-seconds and meters). The data consists of an array of numbers telling the height at each point over the whole area.
- DRG
- Digital Raster Graphic. A digital image (not vector or topographical data), usually mapped to the coordinates on the globe where it appears. Often similar in appearance to a regular "roadmap." May have names of locations, roads, rivers, and topographical features written directly on it along with contour lines.
- GIF
- Graphics Interchange Format. Used for web graphics but rarely for heightfields since, though GIF files have relatively good compression, they only allow up to 256 colors and are more difficult to read.
- Heightfield
A two-dimensional representation of a three-dimensional object. The image to the right is a heightfield image converted from a USGS DEM file of the western Grand Canyon. The "Topography" image at the top of this page was made with a simple heightfield. Usually the brighter color values correspond to higher land areas, but programs such as POV-Ray also accept specially-encoded 16-bit bitmapped files which look like noise when viewed. (16-bit means more values can be used for a single point - up to 65,536 whereas 8-bit only allows 256.)
- SDTS
- Spatial Data Transfer Standard. A standard for encoding spacial information for use across various computer platforms. It includes the ability to encode DEM-type data, line-based data (for boundaries, transportation, and hydrography among others), and various points of interest (cities, counties, etc). For creating graphical renderings it's not as useful as the DEM format since the height data isn't as readily converted to other formats, but there are programs listed below to do just this. SDTS information usually comes in packets of multiple files with the extension DDF and a catalog directory file ending in CATD.DDF. One of its uses is overlaying hydrographic or transportation data over a DEM file to see how roads and waterways are related to the actual geography of the land. (DLGv32 is excellent for this.)
- Targa
- A bitmapped file format, usually with a TGA extension. Very commonly used.
Data - USGS The main USGS web page.
- Tim's Terrains Miscellaneous (some rarer) terrains available in Terragen's "Terrain" file format and standard DEM.
- National Atlas A lot of national U.S. data, downloadable and viewable online.
- Geographic Names Information System Search for data by the name or location of a site.
- USGS: Geo Data A main index for finding where DEMs of different resolutions, various line graph files, and related files and utilities are located on the USGS site. Also includes links to technical documentation PDFs and other resources. I recommend the SDTS tutorial for learning how to retrieve and use topographic information off the Internet; it gives step-by-step instructions, listing all web sites and decompression procedures which need to be followed.
- NIMA DTED data for a large part of the globe. Fairly detailed.
- Base addresses for FTP retrieval of USGS DLG Data and DEM/SDTS Data.
- DRG Availability The USGS's list of free DRG (raster map images) sources.
- GIS Data Depot A commercial site. Allows free downloads of all its data or CD-ROMs can be customized online. Lots of data in many varieties, including DRG, DEM, and other formats. Easy to use.
- FTP or WWW 30 arc-second (1 km?) GTOPO30 grid DEM data for almost the entire globe.
- Best DEM Gallery of American West Very unique and well-illustrated collection of DEMs that would be a good place to start if you're just looking for nice landscapes.
- MAT Data This supposedly has high-resolution data in MAT format for famous locations/mountains. The only programs I know of which read this format are Kashmir and Wilbur (see below). There is one slight problem with this page: My Japanese isn't that good so it was a little difficult to read.
- Terraserver A Microsoft-run site for retrieving actual aerial photographs of places around the world.
- MapBlast One of the many street mapping sites on the Internet. This can provide decimal latitude/longitude data for any U.S. address; all you need to do is give it the address and it does the rest. With the decimal latitude and longitude it provides you can use the advanced search on Terraserver to get an actual aerial image of the location. In other words: Get a view from space for practically anywhere!
Programs - For use on topographic data:
- From the USGS Viewers Page:
- DLGV32 - View DEM, DLG, and SDTS files in the Windows (32-bit) environment.
- DEM2TGA - Convert DEM files to TGA heightfields suitable for viewing or using as POV-Ray heightfields. (These programs are only available here as uncompiled C programs!)
- DEM2TGA - My conversion of the C programs to a Pascal version meant specifically for DOS systems. The archive includes the Pascal source code, a compiled EXE file, and technical documentation. Can output both TGA higher-is-brighter files and POV-Ray heightfields; this minimizes height data loss when normally in conversion to TGA the files are reduced to 256 colors (height levels).
- SDTS2DEM Convert digital SDTS data to DEM format. Since there are few utilities available for binary SDTS data, this program supposedly converts it to DEM so the data can be used elsewhere. Unfortunately, I haven't had much luck with it; it seems incompatible with all three DEM2TGA programs!
- 3DEM Written by the same author as SDTS2DEM. This allows you to make flyby movies in MPEG format or stills. If you have a fast computer you can even fly over DEM terrain in real time. Easy to use, and its stereographic ability allows you to use both red/blue stereo and LCD shutter displays. A useful conversion utility since it can input from regular DEMs, SDTS data, "NASA Mars DTM," and ASCII matrices in text format, and then output to Targa, binary or ASCII matrix formats. Includes interesting features for navigating around Mandelbrot and Julia sets.
- Wilbur Imports and exports practically every bitmapped and topographic image format. You don't really need any other conversion program if you have this! The only program I've seen so far which can import and export formats like MatLab's MAT, Bryce terrain files (!), Terragen surface files (TER), and more.
- For creating images:
- POV-Ray The most well-known (and free) raytracing software. Very advanced, very useful, very flexible. Its main use for topographic information is for viewing higher-is-brighter bitmapped images (TGAs, GIFs, etc) as 3-D heightfields. It can also accept specially formatted 16-bit TGAs as heightfields which allows more than 256 height levels (up to 65,536).
- Leveller A heightfield editor for making your own terrain from scratch. It was used in conjunction with POV-Ray to create the title at the top of this page. Quick and easy, but it's basically a 2-D image editor meant for creating heightfield images for other programs (like POV-Ray). You can only import data from bitmapped files (BMP or TGA) or DEM files, but support for DEMs is not the best. On the plus side, it's easy to create realistic imaginary terrain and has plenty of editing tools - certainly a lot easier for most functions than using an image editor.
- Wilbur Not only does it import and export practically every bitmapped and topographic image format, but it includes image editing tools like Leveller's and quite a few advanced tools such as different map projection and processing features. As opposed to Leveller, you're free to load DEMs of any size and work on the whole image or different areas of it. Get this!
- Terragen One of the best programs out there - my favorite for creating almost photographic-quality images. Terragen is still in the works, but is quite impressive even now. Not as many features as Kashmir, but the ease with which almost perfectly realistic scenes can be made is amazing. The water is good for most purposes, as well as the predefined surface maps (or you can make your own). Although Terragen does allow highly realistic 3-D clouds as opposed to the usual 2-D plasma clouds, you don't have as much control over their creation as Kashmir; for example, you can't elongate the clouds to simulate cirrus and although it supports multiple cloud layers, currently it only renders one layer correctly. Terragen doesn't have nearly as many options as Kashmir but is much more realistic. If you want to import actual topographic data, at least for now it needs to be converted to a 257x257 resolution 8-bit greyscale "RAW" image (I use Paint Shop to do this) or, more easily, loaded from a TER file created by a program like Wilbur. Allows scripting to create animations with programs like my own Camera Path Editor.
- Genesis II By Geomantics. Realistic landscape generation with support for multiple types of topographical data.
- Kashmir 3-D Excellent user interface and hundreds of options for rendering images. It can import almost every topographic file format including some international ones, plus, of course, DEMs. Interesting features, way too many to list. Lets you create almost photorealistic images and create flightpaths to make movie frames out of. Everything on it has presets - the ground, sky, clouds, lens flares, everything, so you can get started right away. Unfortunately, the documentation's a little sparse (to say the least), but since the interface is almost childishly simple - look at all the pretty buttons! - you don't really need it. You can add your own items to the maps as well, landmarks and such, and it can read and show landmarks from topographic files which support them. Also, if your heightfield doesn't have any water information in it, it'll let you pour water where you want it to make lakes and rivers! (The water isn't nearly as realistic as Terragen's, though.) There are two major problems: Unless I'm missing an option somewhere, you can't save the images you create anywhere except in its "Photo Album," which, of course, can only be viewed inside of Kashmir. I ended up using Paint Shop to grab screen shots of my images! There's also one very, very bad thing about Kashmir: Keep backups of all DEM files before loading them! In order to load DEM files, Kashmir will ask if you want them "converted" to Kashmir's format, at which point you have to choose Yes or you will be unable to load it. After clicking Yes, it will overwrite your DEM file, making it completely useless. So always backup your DEM files before using them in Kashmir or keep a copy for Kashmir to "convert" and one to use for everything else.
- Miscellaneous:
- Paint Shop Pro A screen grab is always a sure way to get image data out of a program that doesn't want to export it (DLGv32, for example). Also useful for image processing and conversion to and from different formats.
- WinZip It automatically decompresses/decodes TAR and GZIP (gz) files, which are the most common compression and archiving formats for topographical data. (The USGS uses TAR and GZ exclusively.) The SDTS tutorial has warnings about using WinZip with USGS data files, however - the SDTS Tutorial can be found on the USGS: Geo Data page.