Drought and Rainfall History in Australia This site has moved to http://www.warwickhughes.com/drought/
Read how CSIRO Chief made incorrect claims re SW WA rainfall data on ABC TV 7.30 Report
This site started in 2002 in response to alarmist media reporting of the
drought that Australia was then experiencing. All sorts of hyped
up superlatives, "worst drought ever", "worst drought in a hundred years"
etc became commonly used for what was for most of the country, just
another damned cyclic El Nino drought. The drought has been blamed on "greenhouse"
and we have heard bushfire risk hyped in a similar, unscientific way.
As we start 2004 some farmers can look back on a more prosperous 2003
after the tough times of the 2002 drought.
What lies ahead ?
Media reports talk about another El Nino this year which would have negative
impacts on rainfall.
The Bureau of Meteorology on their Rainfall Outlook page has a bet each
way for the June Quarter;
http://www.bom.gov.au/climate/ahead/rain_ahead.shtml
but on their Forecast ENSO page;
http://www.bom.gov.au/climate/ahead/ENSO-summary.shtml
they point out that their model and a consensus of several models points
to El Nino conditions later in this year.
To see over a years worth of monthly reviews of BoM rainfall
Outlook maps compared against the actual BoM rainfall data go to;
http://www.warwickhughes.com/drought/
Similar reviews of BoM temperature Outlook maps are posted in the Coolwire
8 newsletter found at;
http://www.warwickhughes.com/climate/
Your taxes at work.
ENSO Prediction Based on Solar Cycles
This is a good time to point out that there is an alternative ENSO forecast
based on solar cycles generated by the late and sadly missed Dr. Theodor
Landscheidt which has a good track record with the last few ENSO events.
http://www.john-daly.com/theodor/new-enso.htm
Scroll down 70% of the page, just after his Fig 6.
Dr. Landscheidt has forecast La Nina conditions to develop this year and
running into 2005 which is the opposite of the climate establishment modellers
quoted by the BoM.
My own view is that I have no doubt that solar influences on climate in
general have been played down by the climate establishment due to prevailing
greenhouse dogmas over more than a decade.
While I always look carefully at what the major climate players have to
say, I think we are very lucky that Dr. Landscheidt has laid out
his research to scrutiny on the internet.
Some station rainfall histories to compare.
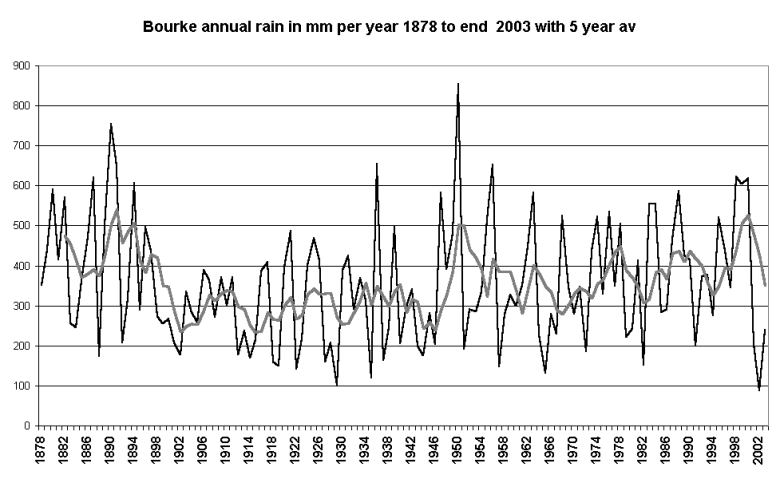
Bourke
The worst hit in 2002 in data I have sighted, all time dryest year.
Central NSW, two Lachlan Valley stations,
annual rainfall 1876-2001 for Condobolin, Forbes P.O.
Deniliquin near the NSW Victorian border
For Tamworth we have composite data, Curlewis used 1891-1902 then Carroll to 1997, 1998 was fudged from a neighbour then Tamworth takes over from 1999. Tamworth
In Western Australia 2003 saw a bumper wheat crop, we now have Merredin updated through 2003.
The Perth annual rainfall graph 1876 to 2003 shows the 2001-2002 dry conditions in relationship to previous dry periods and it is obvious there has been several dry spells worse than recent years.
Looking at the Perth graph of monthly rainfall
anomalies January 1969 to Dec 2003 we also see several past droughts
worse than the moderately dry winter of 2001. Much is made of the fact
that January to March 2004 rainfall has been negligible in Perth and I
have not noticed any informed spokespeople, state that there is no
correlation between rain in these early months and the annual rainfall,
or wet seaon rainfall. So I am saying it here, in Perth a dry January-March is no guide to a dry year.
Looking at these two graphs of Perth rain data one would have to
wonder why the State Government here is planning to build a desalination
plant that would produce water at a cost of three or four times the present
supplies from combined dam and underground resources. There is no shortage
of the present resource assuming normal prudent engineering to plan for
our expanding population. The previous Govt. may have neglected water
engineering works in the face of growing demand but the current Govt. takes
policy into the surreal. See my Perth Water web site.
See new page re cloud seeding.
More material will be posted as it comes to hand.
99% of data is obviously from the Bureau of Meteorology, some
of which I have to buy, some I find, some is from private "web cam" AWS
sites, if you have useful rain records I would appreciate hearing.
Links:
Track all grain and commodity prices
http://futures.tradingcharts.com/
Qld DPI Long Paddock for El Nino Southern Oscillation (ENSO) actual
daily values with 30 and 90 day rolling averages.
http://www.longpaddock.qld.gov.au/SeasonalClimateOutlook/SouthernOscillationIndex/30DaySOIValues/
Site updated June 2004 by Warwick Hughes, email comments etc to wazzau2002@yahoo.com.au
You read it first here.